Monitoring
ILMO should, like every other software, be easy to monitor. Therefore a basic metrics are exposed to https://example.com/library/metrics. The data is encoded in JSON format and is therefore suitable to bea read by humans and it is easy to use it as data source for further processing.
Exposed Metrics
users: number of users (all roles combined)
staff: number of users with staff status
books: number of books
book_instances: number of physical copies of books
book_instances_available: number of available physical copies
materials: number of materials
material_instances: number of physical copies of material
material_instances_available: number of available physical copies
authors: number of authors
loans: number of loans
unreturned_loans: number of unreturned loans
reminder_sent_today: number of reminders that were sent to users on this day
Example workflow
To use the exposed metrics you will usually need a time series database and a visualization tool.
As time series database we will utilize InfluxDB, the visualization tool will be Grafana.
InfluxDB and Telegraf
First we install InfluxDB (e.g. with docker, be aware of the security risks!).
# Pull the image
$ sudo docker pull influxdb

# Start influxdb
$ sudo docker run -d -p 8086:8086 -v influxdb:/var/lib/influxdb --name influxdb influxdb

# Start influxdb console
$ docker exec -it influxdb influx
Connected to http://localhost:8086 version 1.8.3
InfluxDB shell version: 1.8.3
> create database monitoring
> create user "telegraf" with password 'mypassword'
> grant all on monitoring to telegraf
Note
When creating the user telegraf check the double and single quotes for username an password.
Now install telegraf and configure etc/telegraf/telegraf.conf. Modify the domain and your password for the InfluxDB database.
 1# Global tags can be specified here in key="value" format.
 2[global_tags]
 3
 4
 5# Configuration for telegraf agent
 6[agent]
 7  interval = "10s"
 8  round_interval = true
 9  metric_batch_size = 1000
10  metric_buffer_limit = 10000
11  collection_jitter = "0s"
12  flush_interval = "10s"
13  flush_jitter = "0s"
14
15# Configuration for sending metrics to InfluxDB
16[[outputs.influxdb]]
17  urls = ["http://:::8086"]
18  database = "telegraf"
19  skip_database_creation = true
20  username = 'telegraf'
21  password = 'yourpassword'
22
23[[inputs.http]]
24  urls = ["https://example.com/library/metrics/"]
25  name_override = "ilmo"
26  #Data from HTTP in JSON format
27  data_format = "json"
28
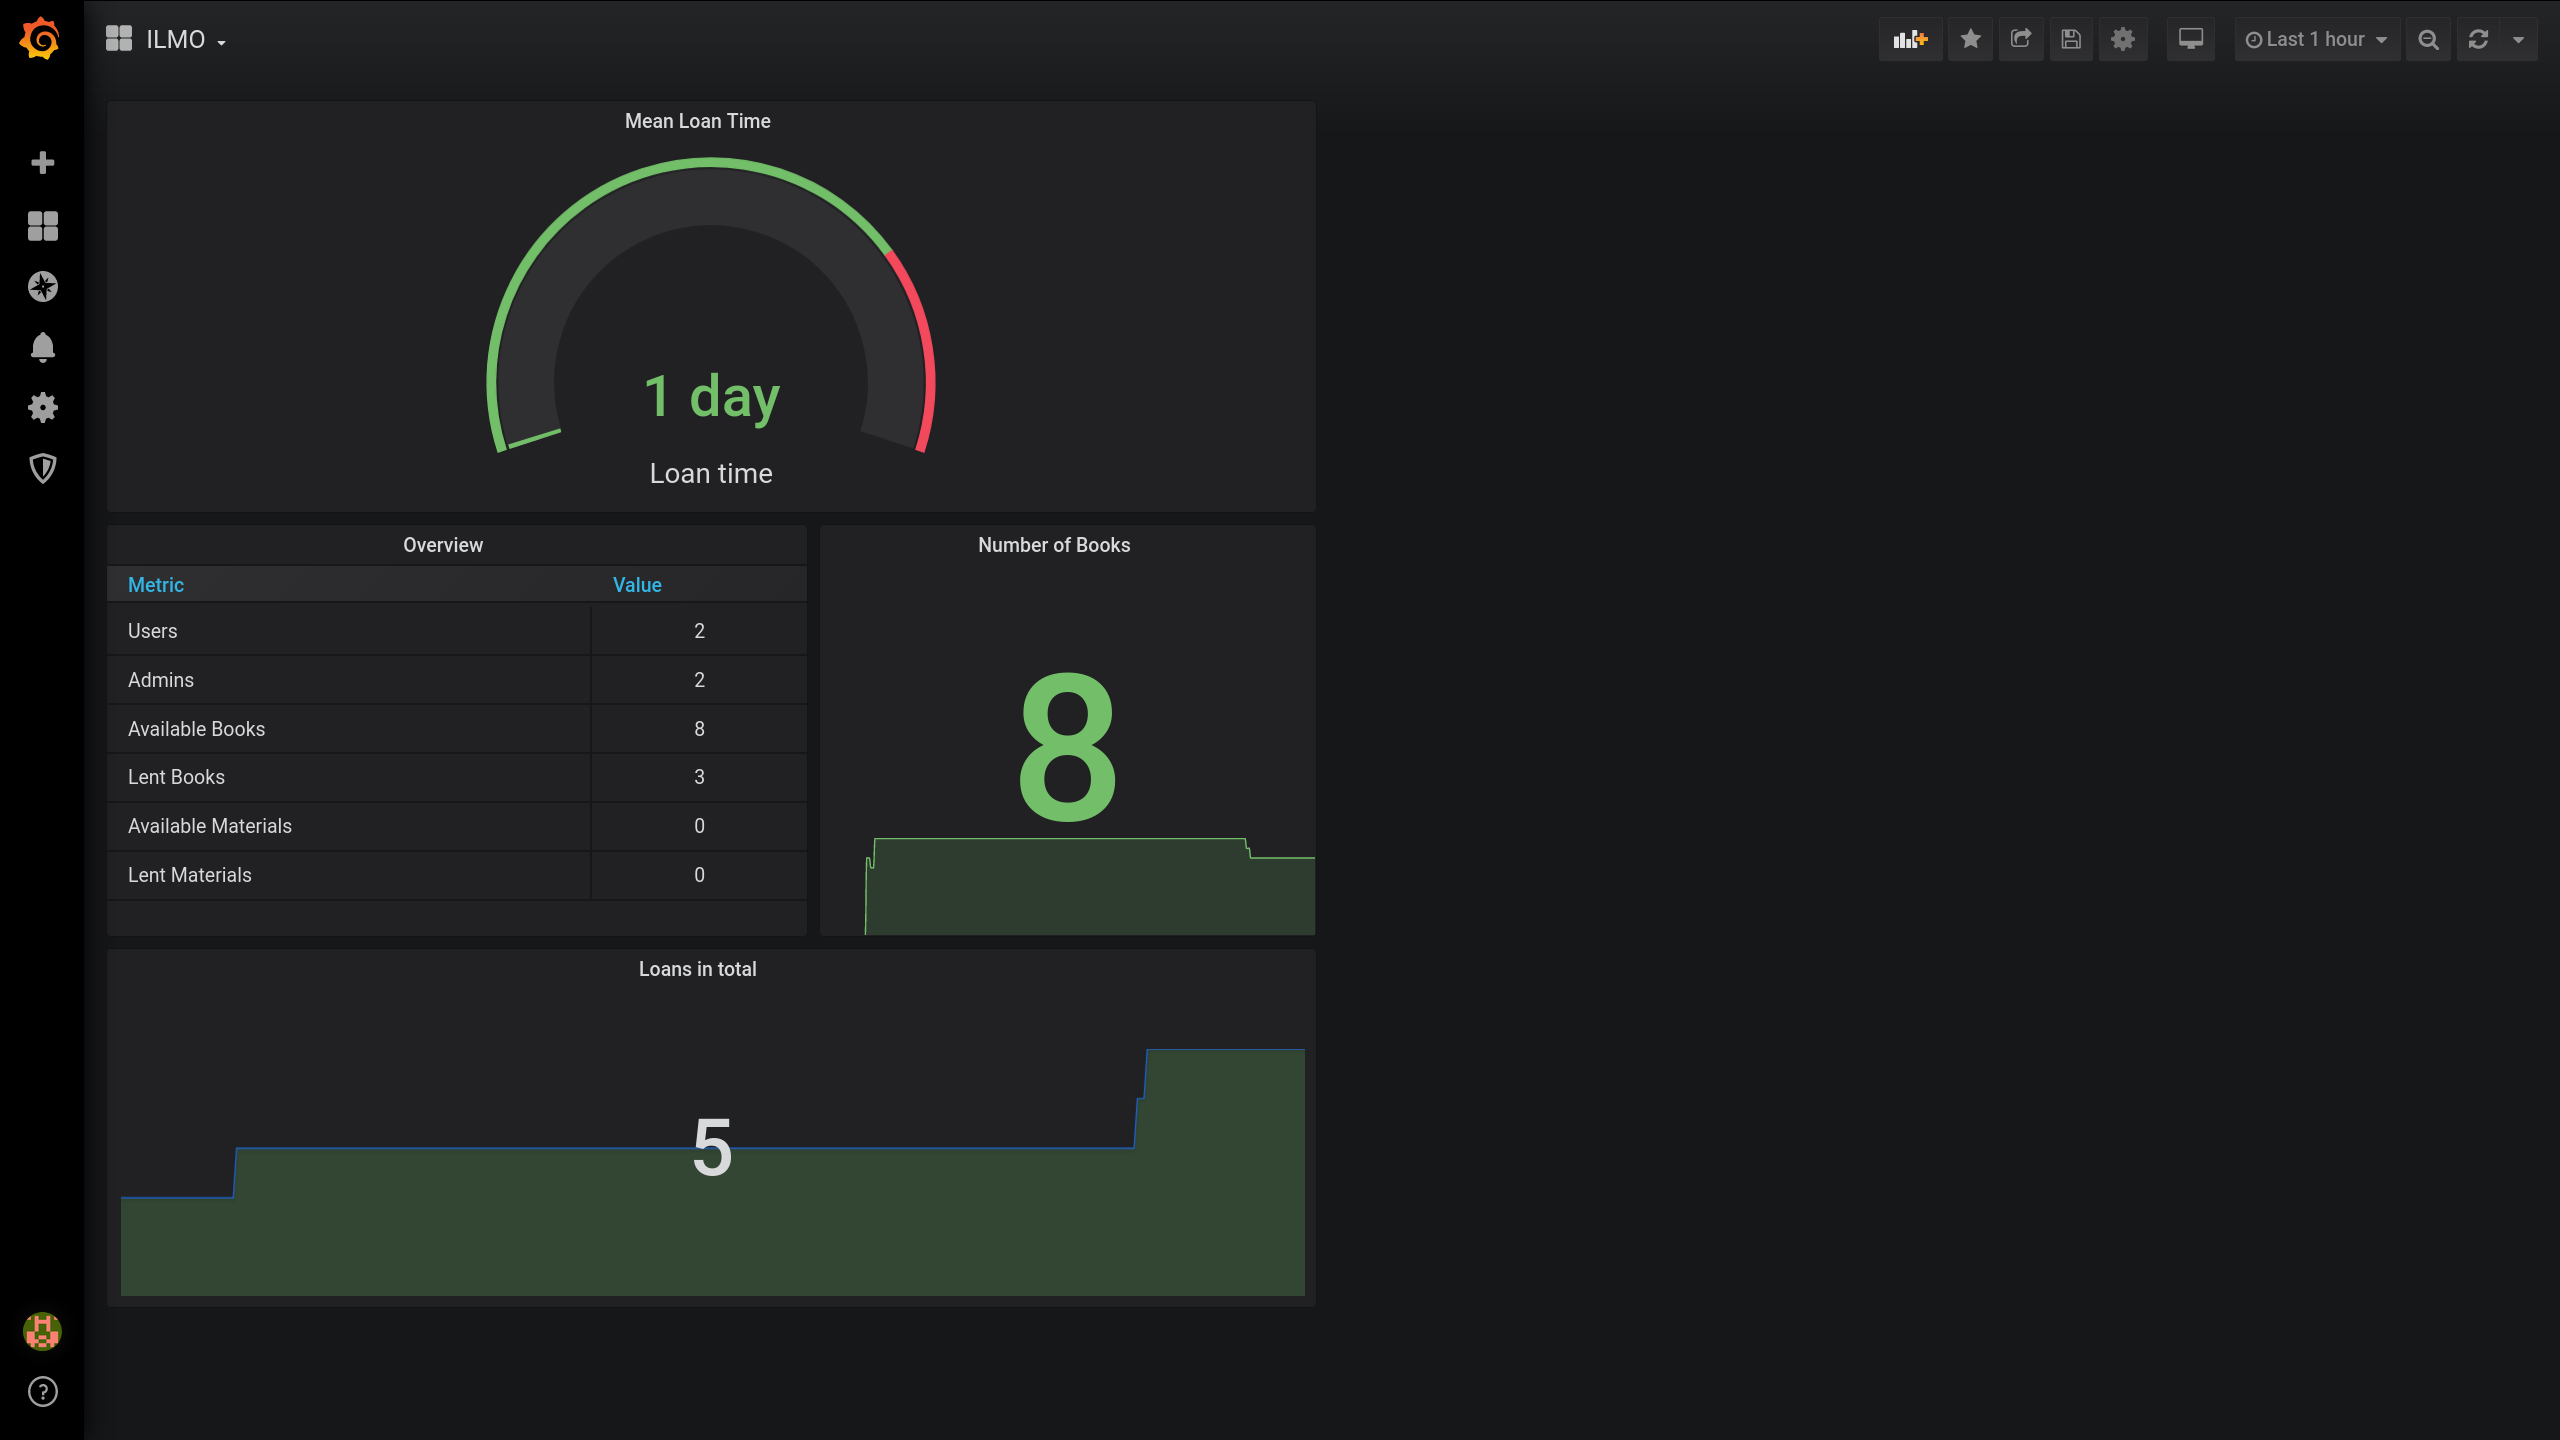
Graphana
Now we can simply use the InfluxDB as data source in Grafana and configure until you have beautiful plots!